The Data Flows Explorer gives you access to all the graphs allowing you to explore the data exchanges between services.
As with all Akwatype graphs, the graph is automatically generated from a number of operating parameters that you can enter (services, routes, topics, messages...)
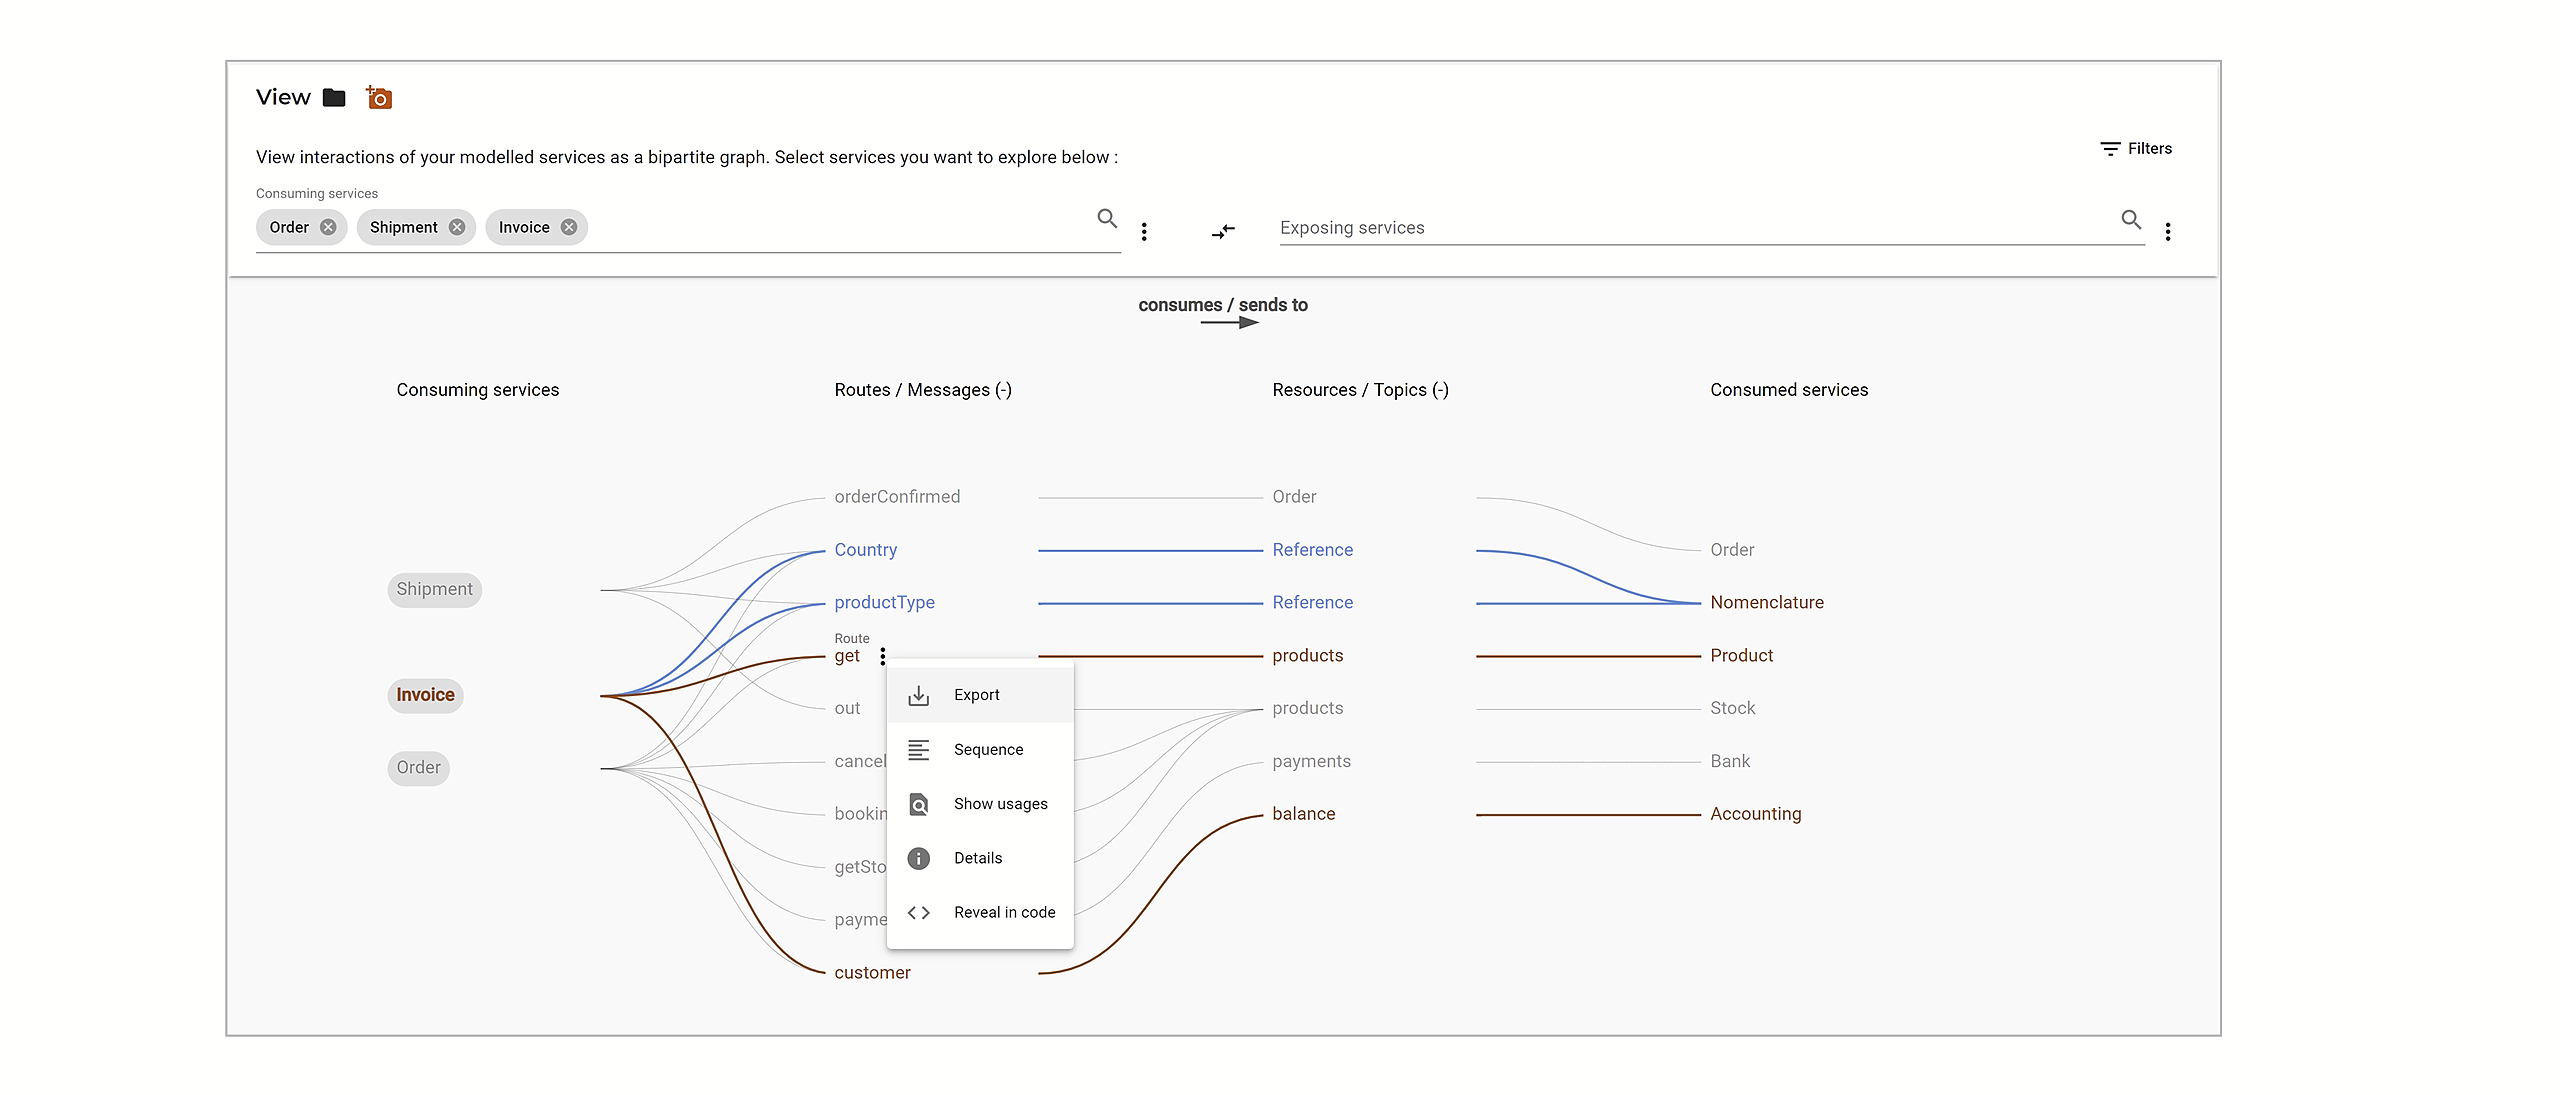
All graphs are dynamic in the sense that a contextual menu at each element of the graph allows, for example, to display information specific to the element, to perform an extraction, to navigate to another representation or to position in the code where the element is defined
All synchronous links (API calls) are in red and all asynchronous links (message exchanges) are in blue
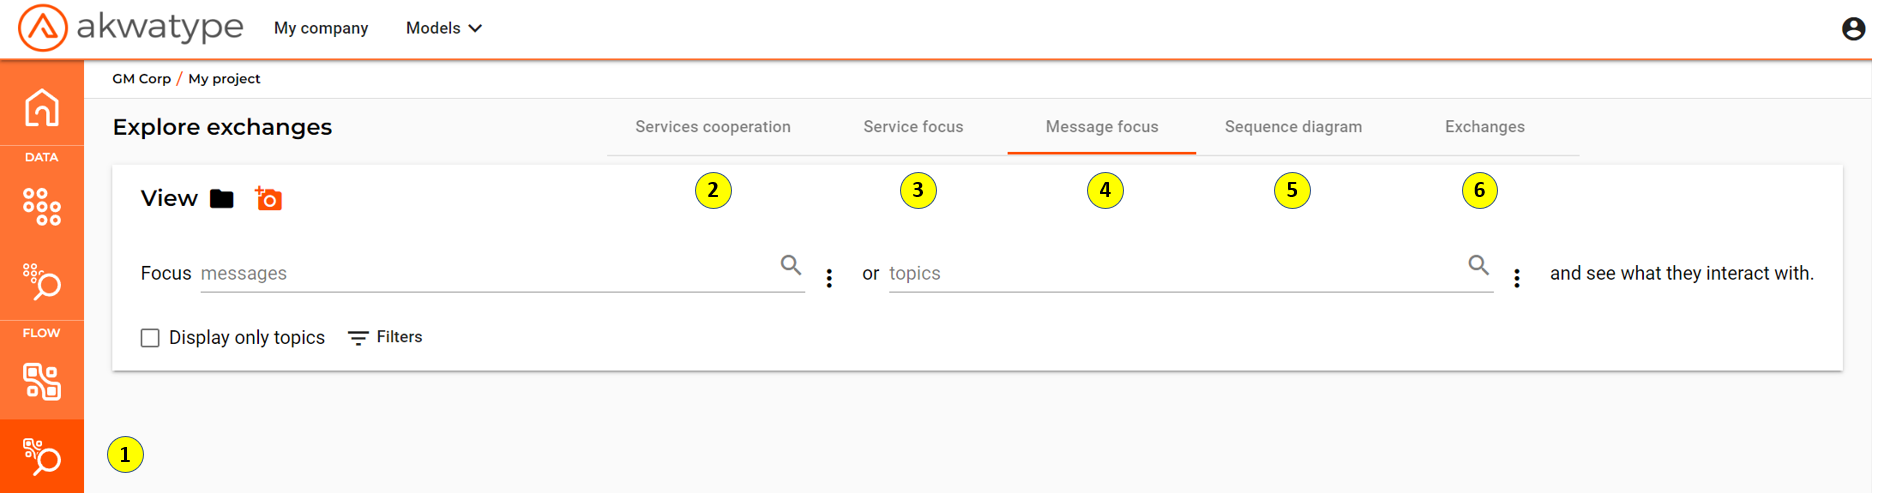
- Icon of the Data Flows Explorer
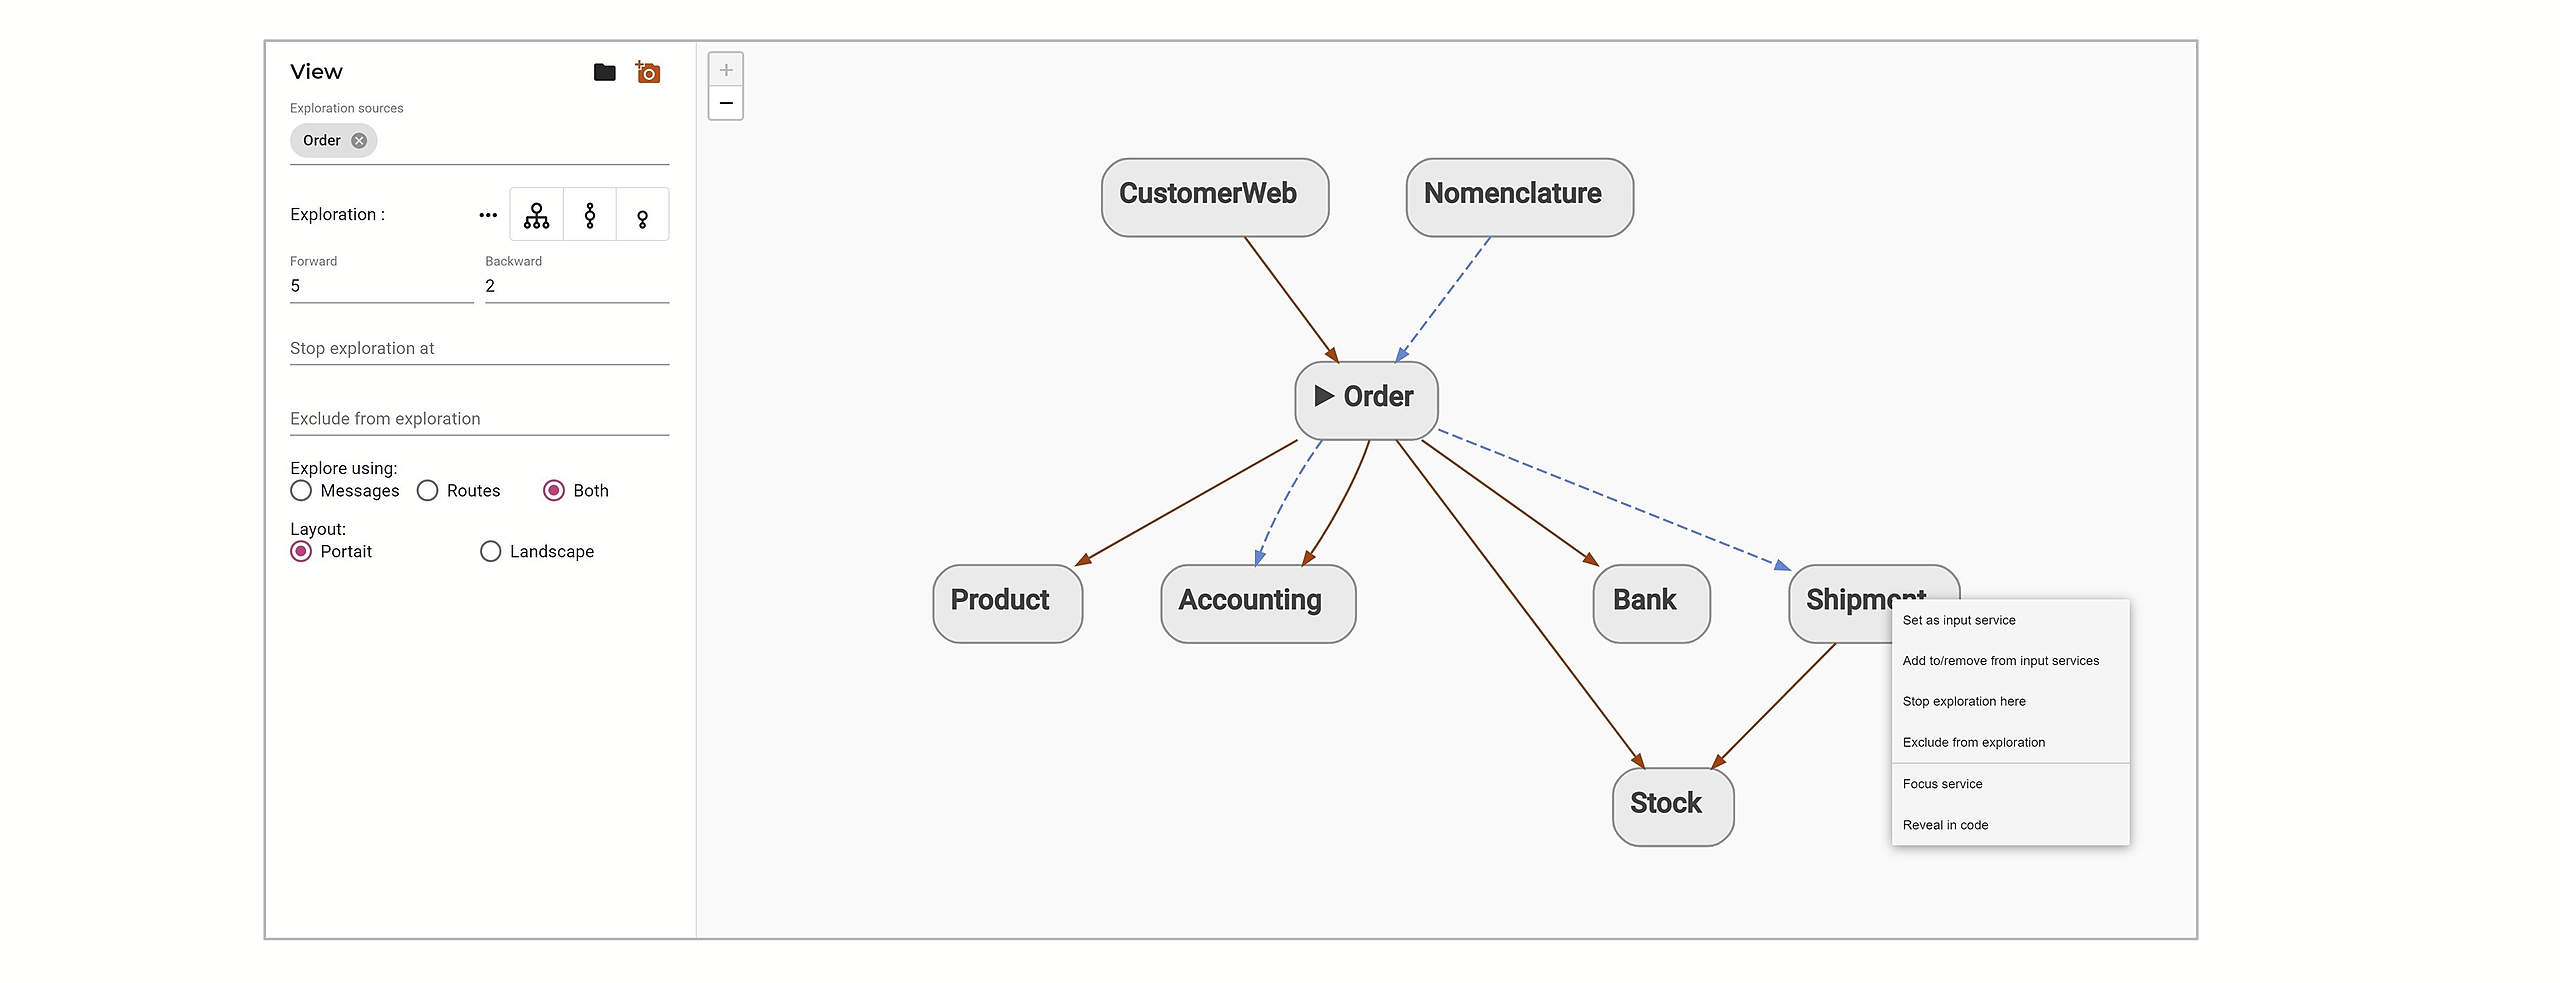
- Service cooperation
- Automatic synthesis graph of the relations between services
- Automatic synthesis graph of the relations between services
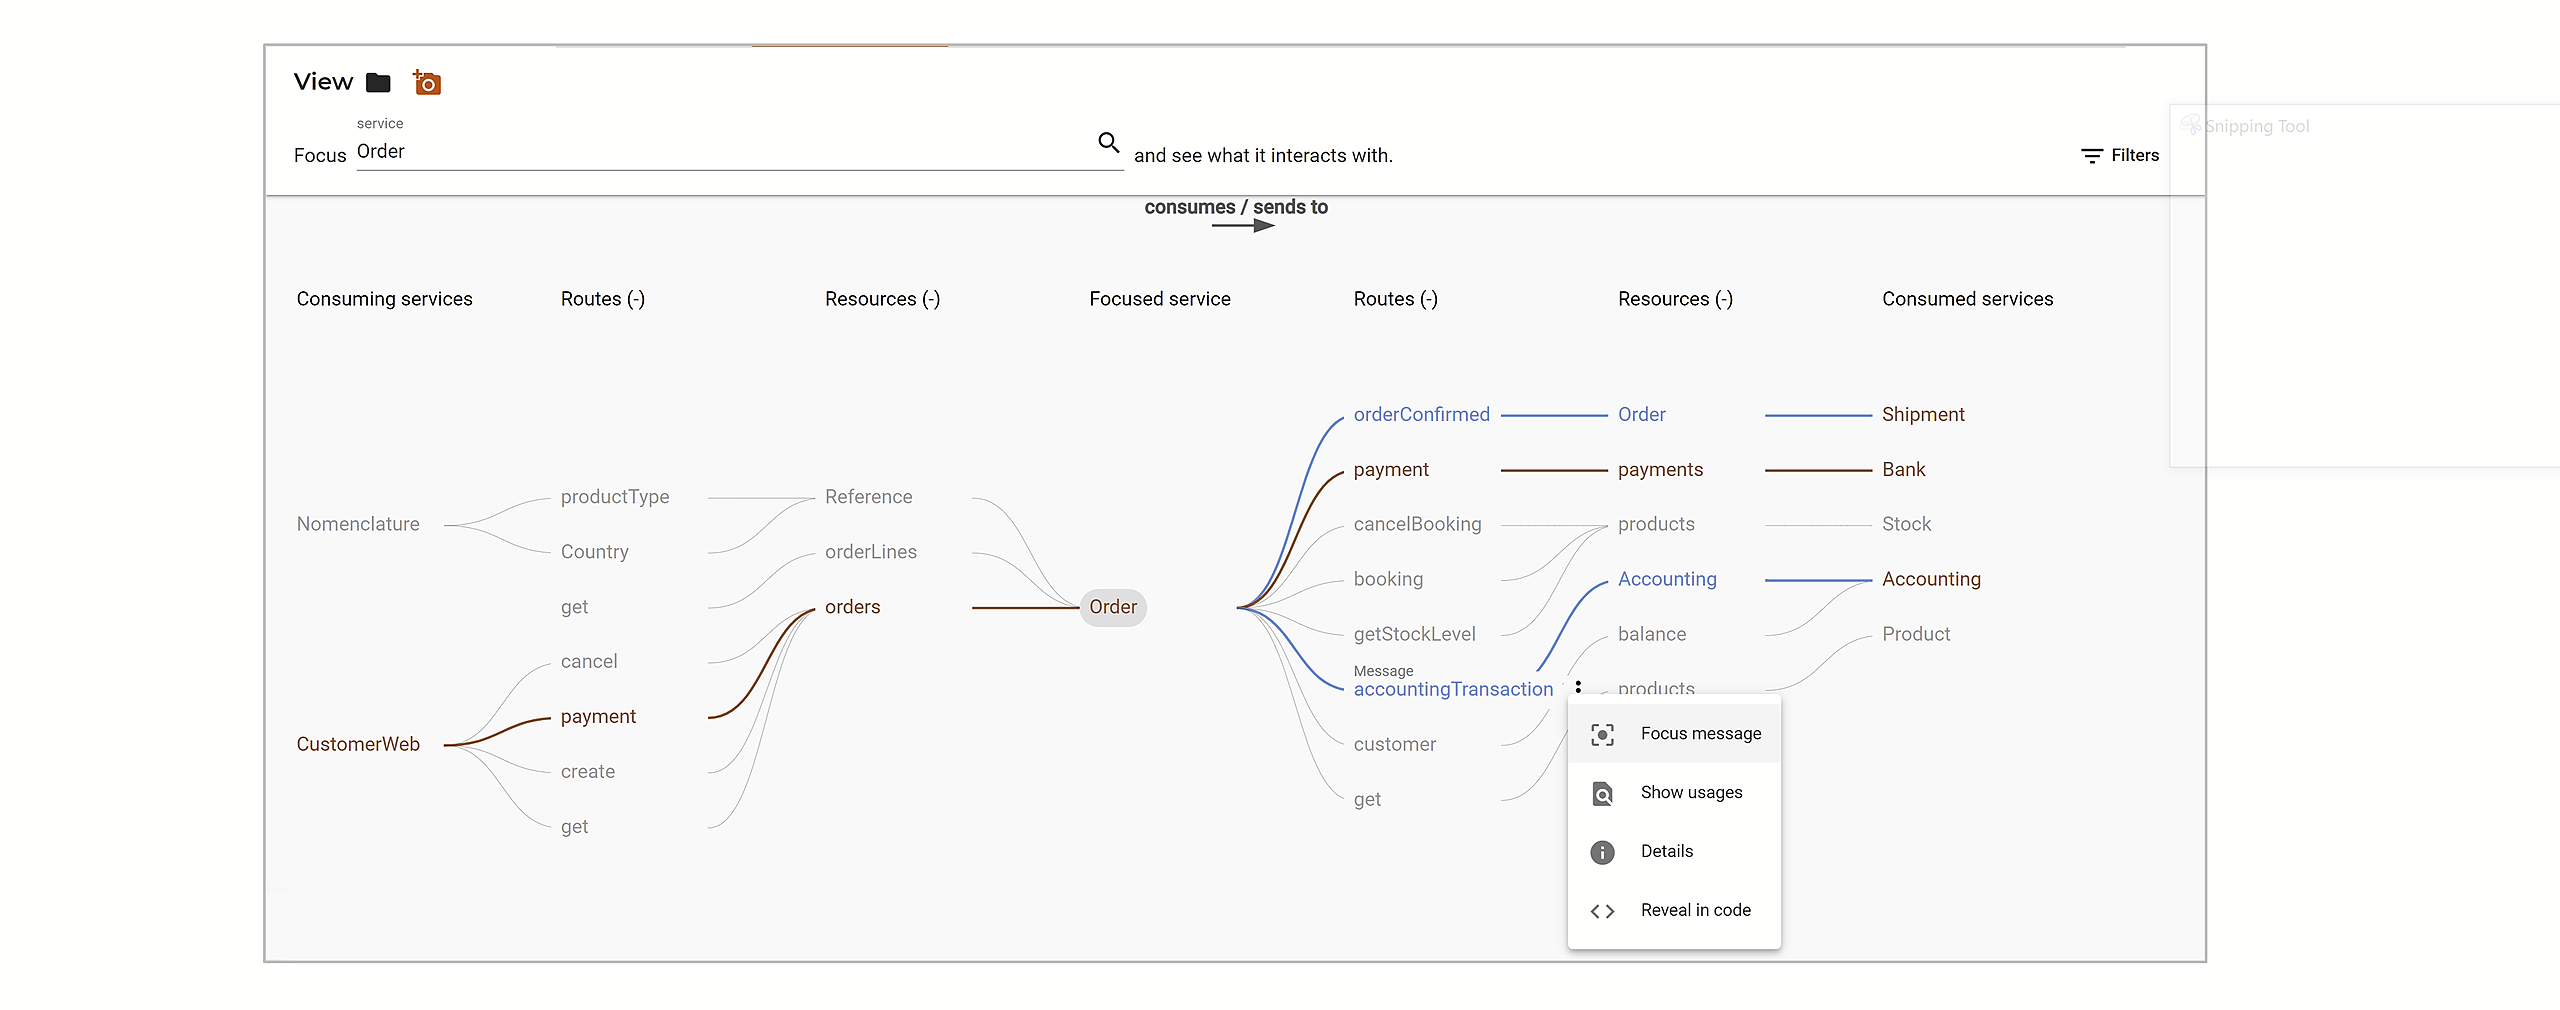
- Service focus
- Interactive graph to visualize the interactions of one service with all the others
- Interactive graph to visualize the interactions of one service with all the others
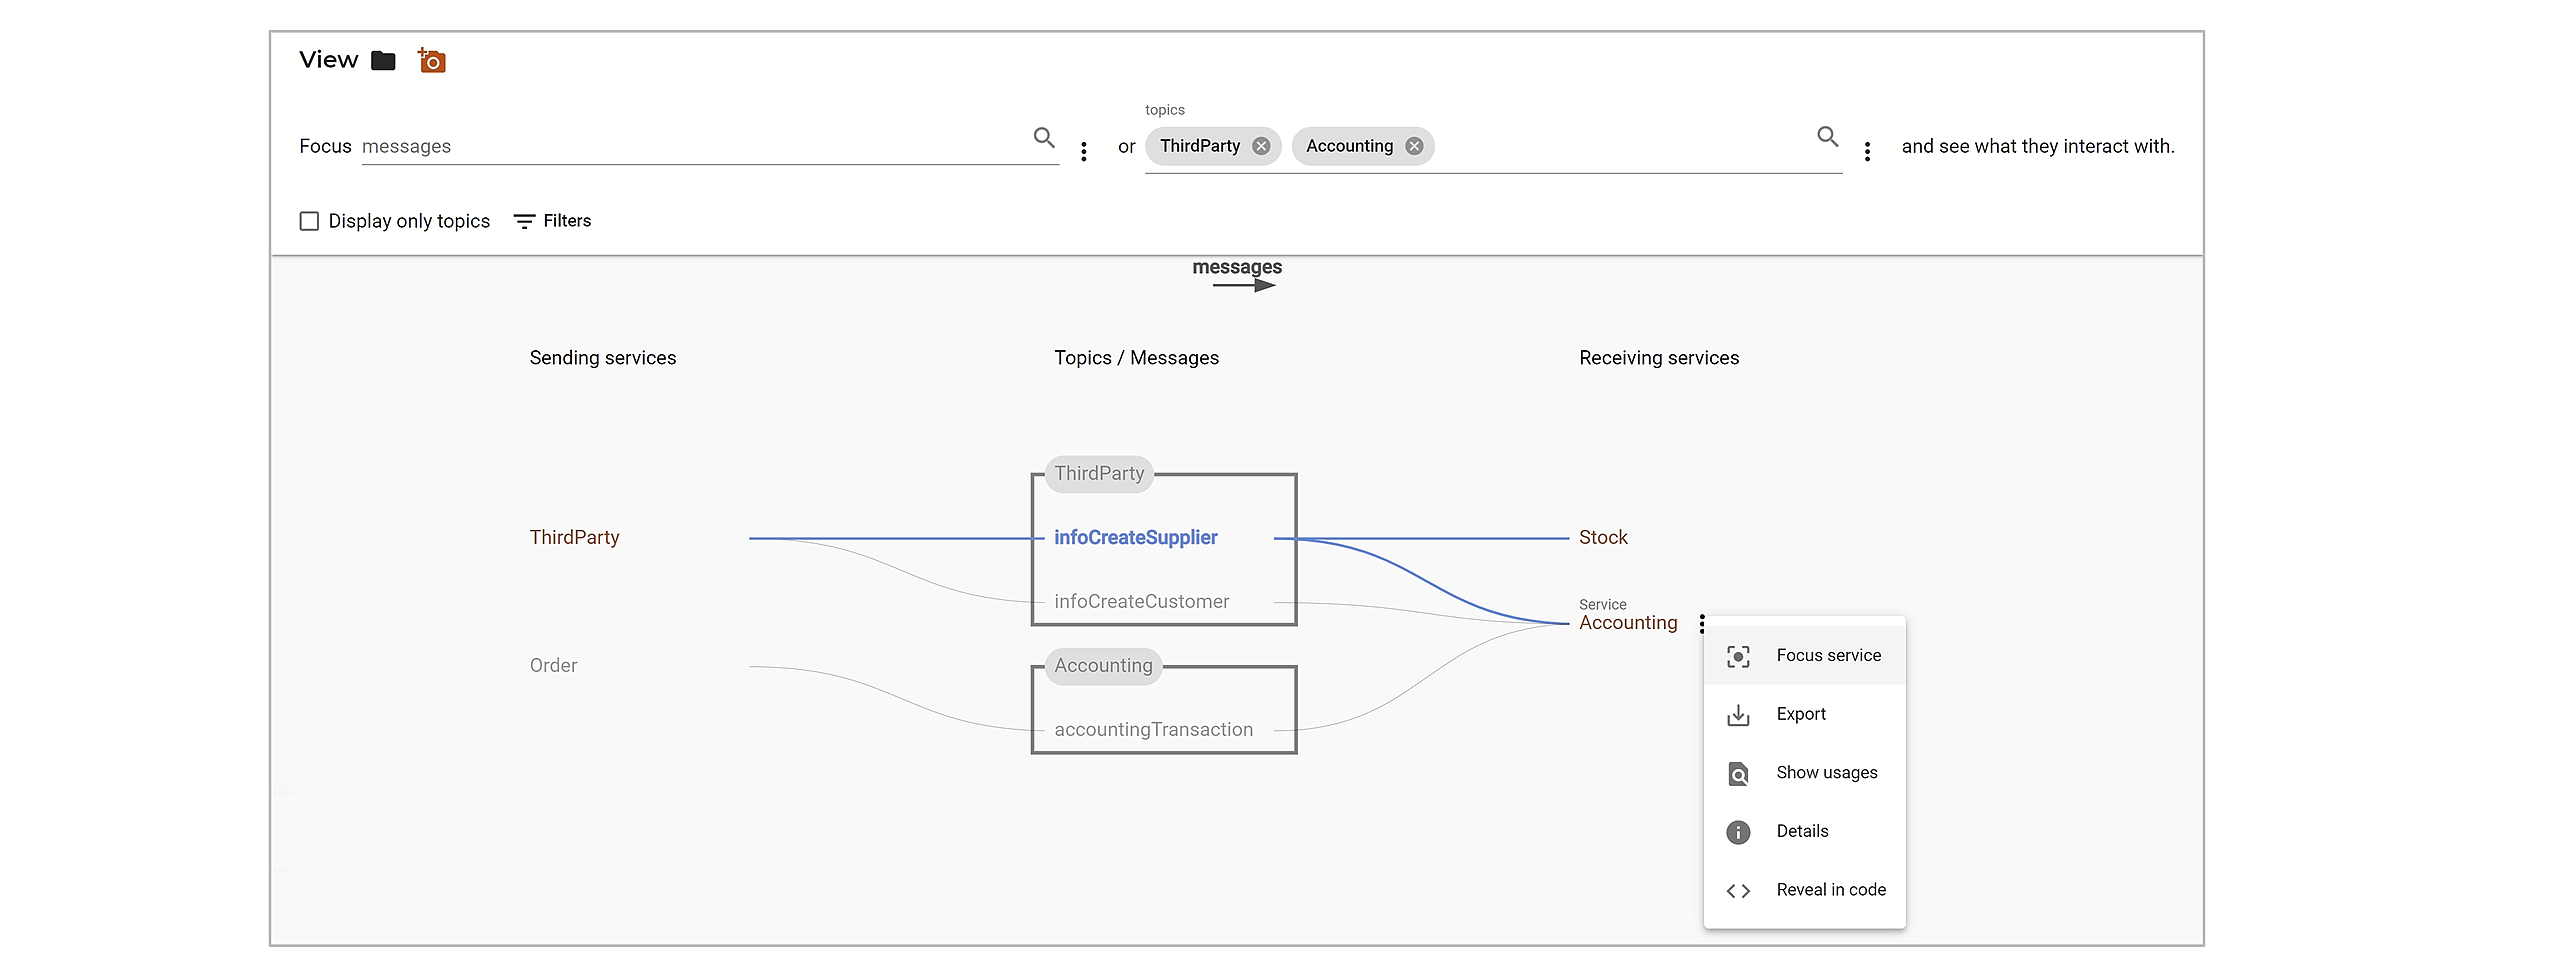
- Messages and Topics focus
- Interactive graph to visualize which services send and receive which messages, and by which topic or queue
- Interactive graph to visualize which services send and receive which messages, and by which topic or queue
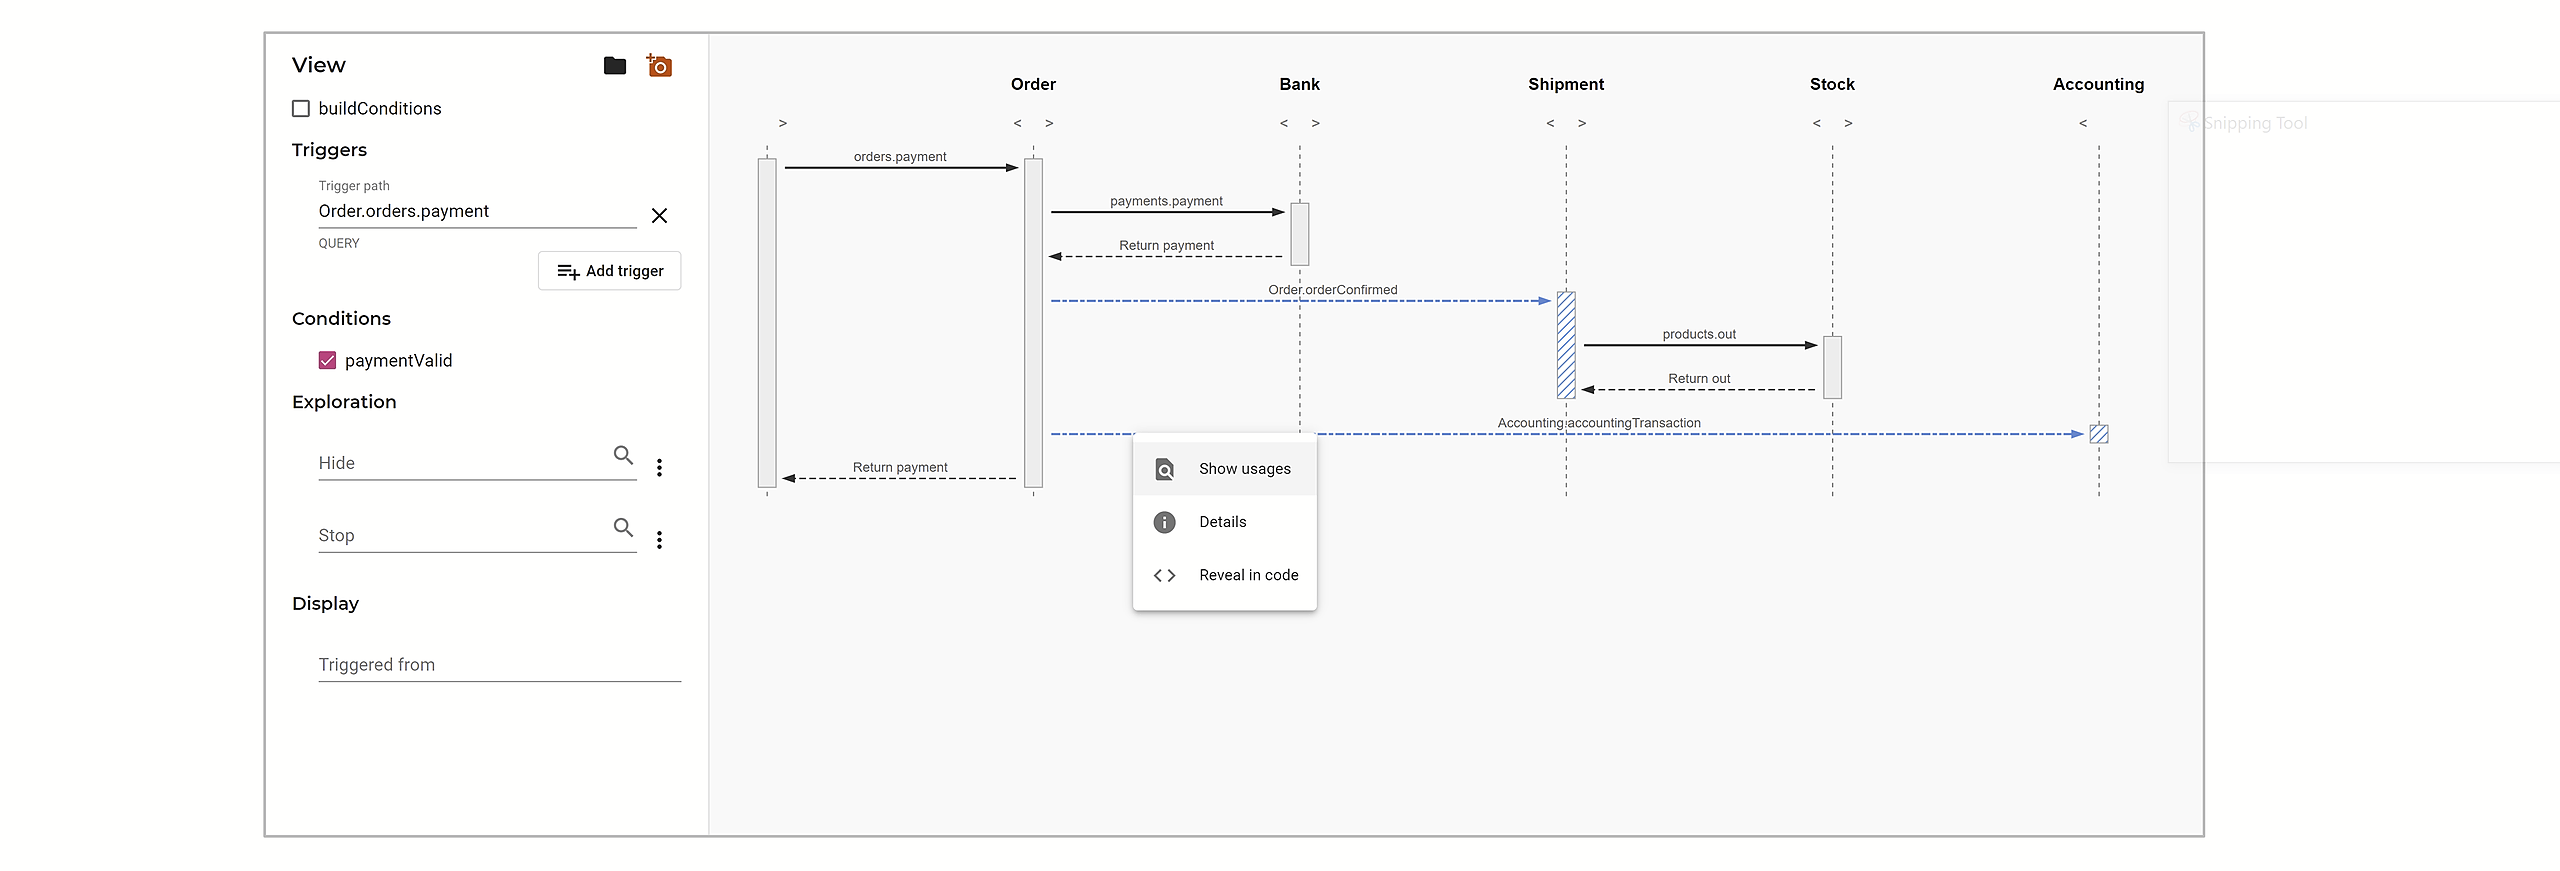
- Sequence diagram
- See all the cascading service calls triggered by the activation of one or more route or/and the receipt of one or more messages on a service
- See all the cascading service calls triggered by the activation of one or more route or/and the receipt of one or more messages on a service
- Exchange
- Interactive graph to visualize the interactions between two or more services
- Interactive graph to visualize the interactions between two or more services